
European housing prices and rents
European housing prices and rents
EU Reporter’s October 7 account of Eurostat data showed housing purchase prices rising faster than rents in the second quarter of 2026. Across the European Union, house prices were 4.7% higher than a year earlier, while rents increased by 3.0%. Against the first quarter, the respective increases were 1.2% and 0.7%.
Purchase prices: national differences
In France, Insee’s second-quarter release recorded a decline in housing prices. The seasonally adjusted index fell 1.0% from the first quarter, following a 0.2% fall in that earlier period. Existing dwellings also became 1.0% cheaper over the quarter, while the index for new dwellings declined by 0.1%. Over a year, the overall index and the existing-home index each fell 0.8%; new-home prices were unchanged. The distinction between new and existing properties therefore appears in both the quarterly movement and the annual comparison.
The Netherlands published a later monthly observation for existing owner-occupied homes. CBS and the Land Registry reported that August prices were 3.3% above August 2025, after July’s annual increase of 3.9%. Against July, the August index edged down 0.1%. There were 18,886 registered transactions during August, roughly 3% fewer than a year earlier; January–August transactions nevertheless rose 4% to 156,028. The average August purchase price was €503,523. CBS distinguishes this unadjusted transaction average from the price index, which accounts for differences in the quality of sold properties.
Separate quarterly CBS figures include newly built homes. In the second quarter, 5,684 new owner-occupied dwellings were sold, 11.2% fewer than a year earlier, despite a 10.9% increase over the first quarter. Their price index rose 4.7% annually but fell 2.2% quarterly. For existing homes, 58,952 sales represented annual growth of 2.7%, alongside a 4.2% annual price increase. The publication marks existing-home price figures as final. New-home prices remain provisional for two periods, while new-home transaction counts remain provisional for four, giving the two segments different revision schedules.
Ireland’s Central Statistics Office reported 5.5% annual residential price growth in July, compared with 5.6% in June. Dublin’s increase was 4.4%, against 6.4% elsewhere in the country. National house prices rose 5.2% and apartment prices 7.5%. The median transaction price for the twelve months to July was €399,999; the highest county median, €684,411, was in Dún Laoghaire–Rathdown, while Longford’s €200,000 was the lowest. A median describes the middle recorded transaction in that period. It has a different role from the quality-adjusted index used to report price changes.
Earlier figures from Portugal describe the first quarter, providing a dated comparison rather than another second-quarter result. The June 23 government summary of INE data reported house prices up 17.8% annually and 3.8% quarterly. Existing homes recorded annual growth of 19.7%, compared with 12.6% for new properties. The number of homes sold fell 8.7% from the first quarter of 2025 to 37,745. Their combined value nevertheless increased 3.2% to approximately €9.9 billion. That publication records a falling transaction count alongside a rising total sales value within the same reporting period.
New and existing dwellings
Spain’s INE reported a 12.2% annual increase in its housing price index for the second quarter. The annual rate was 7.4% for new dwellings and 12.9% for existing homes. Compared with the first quarter, overall prices rose 3.4%, with increases of 1.0% for new properties and 3.7% for existing ones. INE’s administrative information covers about 95% of housing sales. Its calculation uses stratification and regression to adjust for differences in properties, with 2025 as the index reference year. The second-quarter figures in this release were final.
A separate Spanish release measures registered sales in July. Its provisional count was 61,417 homes, up 3.6% from June but down 5.1% from July 2025. New properties accounted for 13,289 sales and existing homes for 48,128; their annual decreases were 1.4% and 6.1%, respectively. These data concern registrations of previously executed deeds in land registers. They therefore attach a calendar month to registration, while the quarterly housing index tracks prices. New homes represented 21.6% of July sales, with existing properties making up the remaining 78.4%.
Bulgaria’s National Statistical Institute released second-quarter housing figures on September 23. Purchase prices rose 4.5% compared with the first quarter and 15.5% compared with the corresponding quarter of 2025. The local quarterly results were uneven. Plovdiv recorded an increase of 5.8%, followed by Stara Zagora at 2.9%, Varna at 2.8% and Sofia at 2.4%. Burgas recorded a 1.5% decline. These city results use the previous quarter as their reference. They describe movements within the national market and should be read separately from the national annual increase.
Latvia’s September 14 provisional release also separated the two housing segments. Overall prices rose 3.9% quarterly, including a 0.7% increase for new homes and 4.6% for existing properties. The annual increase was 11.4%, with new homes up 1.7% and existing ones up 13.3%. Its index covers dwellings bought by households regardless of their eventual use. The statistical calculation adjusts for quality and changes in the mix of transactions. The resulting index describes comparable price development, rather than simply dividing the total value of sales by the number of homes sold.
In Slovakia, second-quarter prices rose 1.4% from the preceding quarter, the slowest quarterly increase since the fourth quarter of 2023. New dwellings rose 2.1% and existing dwellings 1.3%. Prices were still 13.6% higher annually, including increases of 10.0% for new homes and 14.3% for existing properties. Six regions recorded quarterly gains, while Prešov and Bratislava recorded declines of 0.6% and 0.5%. All eight regions nevertheless had annual increases. The Statistical Office uses actual sales prices from contracts registered in the Real Estate Cadastre for this measurement.
Austria’s September 23 release reported a 3.9% annual rise in residential purchase prices across the first half of 2026. New flats and houses rose 3.8%, and existing properties 4.0%. The quarterly index surpassed its previous third-quarter 2022 peak in the second quarter of 2026. A separate owner-occupied housing index increased 2.9% over the first half. Its coverage extends to acquisition-related fees, insurance, repairs and renovations. The house price index instead records actual transaction prices from purchase contracts, so the two measures describe different sets of household housing expenditure.
Finland: quarterly and monthly observations
Statistics Finland’s July 28 preliminary release showed prices of old dwellings in housing companies falling 3.9% annually in the second quarter, while rising 0.1% from the preceding quarter. Annual falls reached 4.2% in Greater Helsinki and 3.5% elsewhere. New housing-company dwellings were 1.7% cheaper nationally than a year earlier: prices fell 5.0% in Greater Helsinki but rose 1.0% in the rest of the country. Sales through estate agents fell 15.7% for old dwellings. The publication separately reported 28.6% fewer sales of new dwellings than a year before.
The later August release, issued on September 29, continued to show annual declines for old housing-company dwellings. National prices fell 3.3% from August 2025 and were unchanged from July. Helsinki recorded a 3.7% annual fall and Turku a 3.3% fall, while Oulu recorded a 2.0% increase. Across the country, flats in apartment blocks became 3.8% cheaper and terraced-house dwellings 2.0% cheaper. Estate agents completed 8.5% fewer sales of these old dwellings than a year earlier. These preliminary monthly figures cover a later period than the second-quarter publication.
Rents paid and rents advertised
Rental statistics use their own populations and periods. Insee’s September 15 release covered unfurnished main residences in metropolitan France, excluding rental charges. Rents rose 0.2% between April and July 2026, matching the increase between January and April. In the year to July, the index rose 1.6%. The private rental sector recorded a 0.9% annual increase, while social housing rents rose 2.9%. The national rental figure consequently combines sectors with different measured changes. Its subject is rent for occupied dwellings, giving it a different scope from housing purchases and from prices displayed in new rental advertisements.
France also publishes a rent reference index, which is calculated using consumer prices. The second-quarter value released on July 10 was 148.37, up 1.15% from a year earlier, following annual growth of 0.78% in the first quarter. Its calculation links the previous year’s corresponding quarter to the movement in the twelve-month average consumer price index, excluding tobacco and rents. The reference period is the fourth quarter of 1998, set to 100. This series therefore has a defined consumer-price formula; it is distinct from the survey-based observation of rents actually charged.
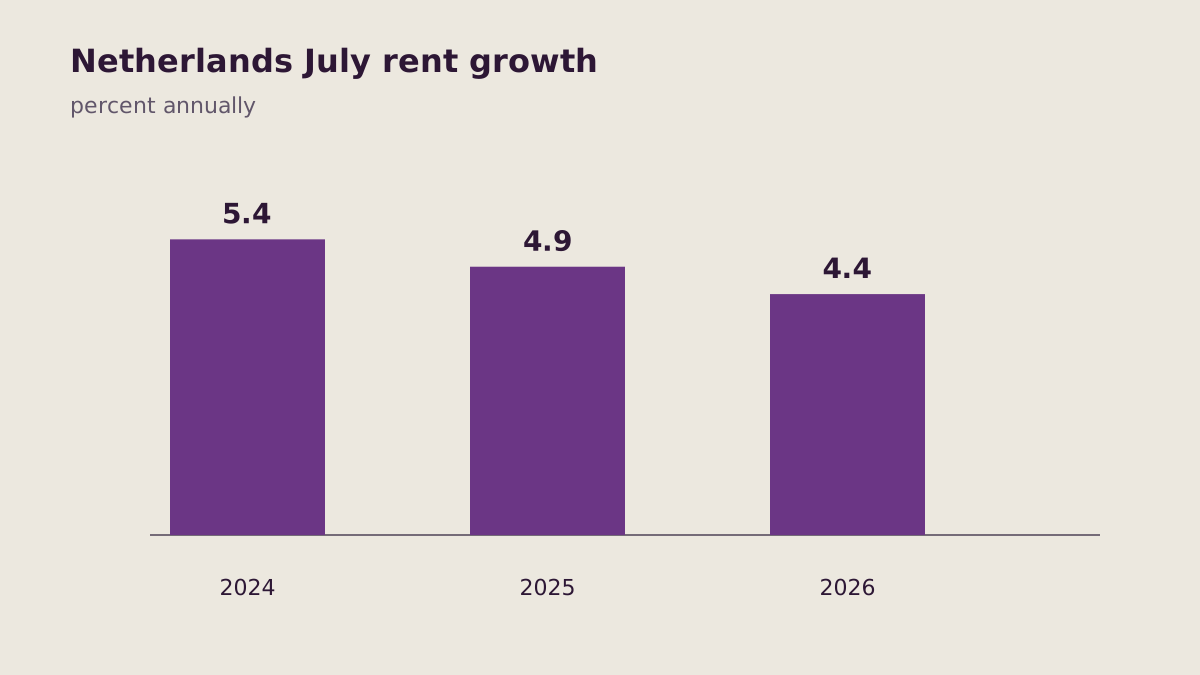
CBS measured a 4.4% annual increase in Netherlands housing rents in July 2026. The corresponding July increases were 4.9% in 2025 and 5.4% in 2024. Social housing rents rose 4.3% in the latest period, compared with 4.5% in the private sector. Excluding changes of tenancy, the increase was 3.8%; changes of tenant contributed another 0.6 percentage points to the overall result. Housing associations own roughly two-thirds of rental properties.
Hungary’s experimental HCSO–ingatlan.com index uses advertised rental prices. In August, asking rents rose 0.7% from July nationally and 0.9% in Budapest. The annual increases were 5.0% nationwide and 5.2% in the capital. Flats represented 93% of the national advertisements used, with detached houses accounting for 7%. Private individuals supplied 44% of national listings and 43% of Budapest listings. These characteristics describe the sample behind the asking-price series. It measures prices offered in advertisements, rather than a comprehensive record of the payments made by households under existing rental agreements.
Finland’s second-quarter rental release reported a 0.1% annual rise in non-subsidised rents nationally. Within that result, Greater Helsinki recorded a 0.3% decline, while the rest of the country recorded a 0.4% increase. Rovaniemi’s increase was 2.0%, Vaasa’s 1.3% and Joensuu’s 1.1%. Porvoo, Kerava and Vantaa recorded falls of 1.9%, 1.6% and 1.2%. Government-subsidised rents followed a different pattern, rising 2.0% in Greater Helsinki and 1.7% elsewhere. The July 16 publication therefore distinguishes accommodation with different subsidy status, as well as differences between cities and the capital region.
A separate April 28 methodological notice explains changes in Finland’s rental statistics. The reference year became 2025, set to 100, and the weights were updated to reflect the current building stock. Statistics Finland usually changes the monthly and quarterly rent index’s base every five years. Water charges were excluded in line with Eurostat’s recommendation, and data validation procedures were also updated. Because these changes affect the content and processing of observations, the agency states that average rents and distribution figures are not fully comparable with those published before the change.
Housing supply: completions and work in progress
Ireland completed 8,823 new dwellings in the second quarter, 3.6% fewer than a year earlier, according to the July 30 release. Apartments accounted for 2,658 completions, down 12.2%; scheme dwellings accounted for 4,738, up 2.0%; single dwellings accounted for 1,427, down 3.7%. Dublin supplied 36% of the national total and the Mid-East region 19.6%. The completion measure is based on electricity connections. Its categories identify the types of dwellings entering use during the period, with apartments, scheme dwellings and single dwellings recorded separately.
The CSO’s August 26 construction release reported residential production volume up 5.5% quarterly and 12.6% annually in the second quarter. The corresponding value increases were 6.6% and 16.0%. Residential activity includes new building, but also repairs, maintenance, extensions, retrofitting and solar panel installation at existing dwellings. Work on a project can enter the production measure over several months. The completion series counts a dwelling when its electricity connection is recorded. The agency explicitly identifies these timing and coverage differences, which explain why activity and completion figures cannot be treated as interchangeable.
Bulgaria’s August 3 release reported permits for 2,216 residential buildings containing 11,499 dwellings in the second quarter. The permitted dwelling count was 15.2% lower than in the first quarter but 14.0% higher than a year earlier. Construction separately began on 1,774 residential buildings containing 8,913 dwellings. The number of dwellings started fell 12.6% quarterly and rose 10.5% annually. The publication thus distinguishes municipal authorisation from the beginning of building work. It records building counts and dwelling counts separately, since a residential building can contain more than one home.
Hungary’s first-half construction release recorded 6,278 new dwellings put into use, 22% more than a year earlier. Permits and simple declarations covered a separate 16,588 planned dwellings, up 29%. Budapest accounted for 2,224 completed homes; four districts supplied 83% of that capital total. The average completed dwelling measured 94.5 square metres nationally and 65.8 square metres in Budapest. Homes built for sale represented 68% of completions, against 29% built for own use. These figures describe completed housing and authorised plans as separate stages within the first six months of 2026.
Construction and maintenance prices
France’s second-quarter construction cost index stood at 2,103, increasing 0.91% quarterly and 0.81% annually, Insee reported on September 23. Despite its name, the series measures producer prices agreed between clients and building firms for newly constructed dwellings. Land costs, development costs and financing costs are outside its scope. Its reference period is the fourth quarter of 1953, set to 100. The result consequently describes prices for a defined building service, rather than the complete price paid by a household purchasing a home together with its land.
Insee also publishes a separate maintenance and improvement price index. Its August 27 release showed a 0.8% quarterly increase for all covered buildings in the second quarter, with annual growth of 2.1%. For residential buildings, prices rose 1.0% quarterly and 2.1% annually. Joinery prices increased 1.6% over the quarter; plumbing, heating and air-conditioning work rose 1.3%; painting and glazing rose 0.8%. The survey follows prices charged by building enterprises, net of tax. This gives repair and improvement work its own observed price changes alongside the separate series for constructing new dwellings.
Statistics Austria’s September 15 preliminary release put August residential construction costs 5.3% above a year earlier and 0.1% above July. The index stood at 105.6 on a 2025 base of 100. Its inputs include materials, energy, transport, labour and the use of machinery for construction projects. These are costs incurred by contractors while delivering work. The publication distinguishes them from construction prices charged to clients, which also reflect productivity and contractors’ margins. The residential input-cost series therefore follows the resources used in building rather than completed dwellings’ purchase prices.
Hungary’s quarterly construction cost table, updated on September 29, separated labour and material costs. With the corresponding quarter of the previous year set to 100, the second-quarter 2026 overall index was 108.3, the labour index 110.4 and the material index 107.8. The annual increases were:
- Overall building costs: 8.3%.
- Labour costs: 10.4%.
- Material costs: 7.8%.
On the separate 2025-average reference base, the overall second-quarter index was 107.5. The table’s two reference systems distinguish an annual change from a level relative to an entire base year, preserving the comparison period attached to each number.
Just Published
European housing prices and rents

Schneider–PTC: the industrial data integration test behind the deal
Avio USA starts work on its Virginia manufacturing site

One equity market, two currency measures

Russia’s draft budget raises spending and borrowing plans

Russia Sets the 2027 Minimum Wage at 28,935 Rubles, Up 6.8%, on the Way to 35,000 by 2030
Partner news digest
 Qatar LNG expansion: readiness, financing and the production test
 Pennon’s capital plan: turning finance into better water outcomes
 Italy’s diesel relief gap: taxes, price ceilings and implementation
 EU–China hybrid trade: from understanding to measurable implementation
 Schneider–PTC: the industrial data integration test behind the deal
 IKEA’s hybrid resale model: buyback, marketplace liquidity and furniture logistics
 Banking AI beyond the ranking: capability, execution and evidence of value
 Fishing labour beyond the product label: practical protection
 Rhenus and the Middle Corridor: terminals need coordinated connections
 Royal Mail restructuring: the test is reliable delivery
 Fuel Finder on Google Maps: when price transparency becomes useful competition
 Samsung’s memory profit surge: what the preliminary record explains
Leave a comment