
One equity market, two currency measures

Two stock indices can describe one national equity market while recording different changes on the same day. That does not necessarily mean the news is inconsistent. Alongside the constituents and calculation rules, the currency of measurement matters. When the indicators use different units, comparison requires further questions: which period is covered, which exchange-rate observation enters the calculation and what the reported movement actually represents. Without those distinctions, a small difference between percentages can acquire a broader meaning than the underlying data supports.
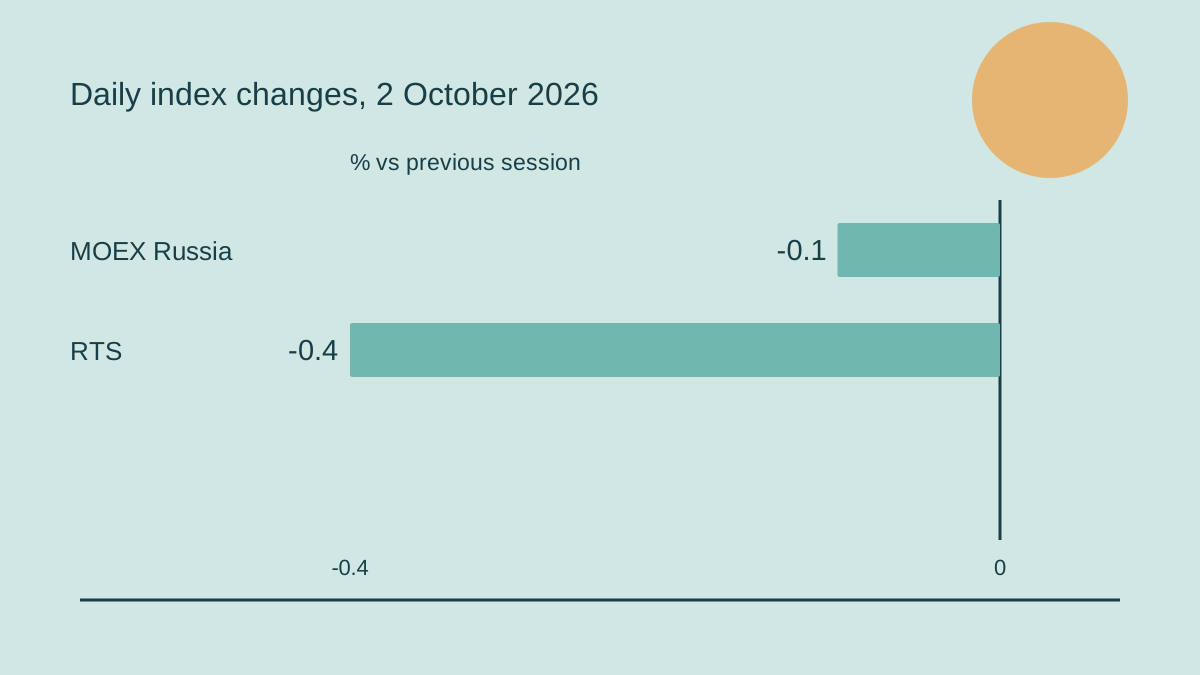
Interfax reported on 2 October 2026 that the MOEX Russia Index ended the main session at 2,277.21 points, down 0.1%. The RTS Index stood at 859.29 points, down 0.4%. These observations describe the equity market in Russia during a specific trading session. Their different percentage changes provide an opportunity to explain the currency basis of comparison. They do not establish the return of an individual's portfolio or allow an exact exchange-rate movement to be reconstructed from the rounded figures.
The exchange’s official index description identifies these as equity benchmarks weighted by market capitalisation. MOEX Russia uses roubles and RTS uses dollars; this currency distinction is the starting point for the explanation.
Points in two indices are not comparable cash amounts
Each index has its own starting base and rules for expressing the value of included shares in index points. The levels of 2,277.21 and 859.29 are therefore not two prices for the same object. The larger first value does not mean that the corresponding market is more expensive in that proportion. To examine movement, readers generally compare each index's percentage change against its own previous basis. The report follows that approach with falls of 0.1% and 0.4%, separating the absolute level from the change over a period.
Points help track a continuous series, while percentages help compare movement over time. Even percentages require a common period and an understanding of the method. A daily change should not be placed beside a weekly or monthly figure without explanation. Nor should an observation at the end of the main session automatically be described as the result for another trading regime. Naming the observation time reduces the chance that two accurate numbers will support an inaccurate comparison. Here, the starting reference is the main session described by the source on 2 October.
The currency basis introduces another factor
Rouble and dollar representations of share value reflect different aspects of an assessment. If a share's rouble price is unchanged, its dollar equivalent can still move with the exchange rate. If both the rouble price and the exchange rate change, the dollar measurement depends on their combination. Currency is consequently more than a decorative label beside an indicator. It defines the unit in which a reader observes the result and influences the question the data can answer.
A local-currency measure may provide a useful starting reference for someone considering rouble values, while analysis in another currency needs a different representation. Neither becomes universally correct or incorrect merely because the units differ. They answer different questions. Readers should first decide whether the subject is the change in share prices in the local currency or the change in their equivalent for an external observer. This prevents an unproductive argument over which index supposedly provides the only authentic account of the market.
Subtracting percentages does not recover an exact exchange-rate change
The report gives rounded daily changes of minus 0.1% and minus 0.4%. Their arithmetic difference is 0.3 percentage points. That difference should not automatically be called the exact currency movement. Currency conversion involves ratios rather than simply subtracting rounded percentages. The relevant exchange-rate timing, precision of the inputs and calculation rules also matter. Working backwards from two short lines in a news report would create an appearance of precision that the published observations do not supply.
A more careful conclusion is limited to the observed direction: the dollar-based indicator fell more than the rouble-based one in the reported data. That is consistent with currency basis being relevant, but it does not replace checking the official methodology. Explaining the general principle only requires separating price and currency components. Naming an exact contribution requires a coordinated set of underlying observations. Readers receive a more useful explanation when an article distinguishes the known result from calculations needing additional information.
The official exchange rate has its own effective date
Interfax also reported the central bank's official dollar rate effective from 3 October: 83.4839 roubles, up 23.85 kopecks. That observation has a separate application date. It should not be inserted without verification into an exact reconstruction of the two indices at the end of 2 October trading. Related news can concern nearby events without sharing identical timing. The official rate therefore remains a separate reported fact here, rather than proof of the precise cause of the difference between the indices.
This separation is useful when an operational market report places trading results, official rates and participant comments alongside one another. Each item may have its own observation time. A subsequent calculation needs to establish those times instead of assuming they match. For understanding the daily news, it is enough to retain each indicator's date and avoid combining them in an artificial formula. That preserves the available information without attributing greater precision or coordination to it than the source establishes.
An aggregate movement does not describe every share
The report characterises the session as consolidation amid mixed movements among major shares. A small decline in an index can coexist with increases in some companies and larger declines in others. An index combines constituent movements using specified weights, so an individual share need not follow the aggregate percentage. This establishes an important limit: a statement about the market does not describe every included business. Discussing a particular share requires its own price, period and relevant events, rather than only the direction of the combined indicator.
An analytical account can distinguish market breadth from the index value. Breadth concerns which constituents rose or fell; the index value is the output of a defined calculation. The two observations complement one another without being interchangeable. A broad, relatively even movement and a pronounced change in several heavily weighted shares could generate similar aggregate results. Constituent information is needed to distinguish those explanations. Mixed share performance therefore does not contradict the small overall decline reported for the session.
The calendar horizon changes the meaning of a comparison
A single day captures a short part of the market's path. It does not establish the direction of the year or determine the following month's result. Even a weekly outcome can differ from the final day's movement because earlier sessions developed differently. Readers should choose the question first: what happened on Friday, what changed across the week, or what happened from the beginning of a longer period? The corresponding series can then be selected. Reversing that sequence lets an incidental figure answer a question it was never intended to address.
The same care applies when combining currency and shares. An exchange-rate change over a week cannot explain a daily difference without further information. A monthly observation should not be described as the result of one session. A short report may place several horizons together because it summarises different developments. Independent analysis must separate them. This is not complexity for its own sake: the period is part of the indicator, just like its sign, unit and comparison basis.
An index is not an individual's actual portfolio result
A person's portfolio may differ from the index in its holdings and weights. Even a similar group of shares produces a result affected by acquisition dates, transactions and costs. A published daily index movement therefore does not establish every shareholder's gain or loss. That requires records for the particular portfolio. The distinction between an aggregate measure and an individual history remains important when currencies are discussed, because the currency of someone's obligations or goals may differ from the index's unit.
Dividends and other receipts introduce another methodological question. A price series and a total-return measure are not automatically equivalent. Before comparing them, a reader should establish which payments are included and how they are treated. This article does not calculate personal returns or select investments to purchase. It explains the information needed to read two indices accurately. The distinction leaves a clear boundary between general trading news and an assessment requiring someone's own financial records.
Market context and measurement should remain separate
Interfax discusses several factors around the session, including oil-price movements, sanctions risks and political expectations. Such developments provide context, but they do not become measured contributions to the index result. One report cannot reliably allocate the day's percentage between oil, currency and an individual statement. That would require a different analysis and further data. An informational account can name relevant context carefully without presenting a possible explanation as a numerically established share of causation.
Currency basis concerns how value is expressed, whereas comments about trading causes interpret participant behaviour. These levels may be connected, but they remain different. Even if two indicators concern the same market, their difference cannot simply be assigned to whichever news factor seems most prominent. Measurement should be understood before interpretation is assessed. That order reduces the chance that an engaging comment replaces verification of units, observation timing and the data needed to understand the published result.
Preserving meaning in a table or illustration
Two percentages on a common scale can illustrate the daily movements: minus 0.1% and minus 0.4%. The labels should identify the date and nature of the observation. The levels in points can be listed separately without turning them into bars representing comparable cash amounts. If an image displays daily changes, it should not also claim to show annual returns or a forecast. Its visible meaning must remain within the information used to create it, without adding invented statistics.
- Retain each indicator's name and unit.
- State the date and change period.
- Distinguish percentages from percentage points.
- Keep different index point bases separate.
- Separate reported observations from explanations of their causes.
This sequence also helps with other financial comparisons. The important issue is the question the bars answer, rather than their colour. Labels in two languages should preserve identical numbers, signs and periods. Translation must not turn a decline into an increase or an observation into a forecast. When those conditions are met, the illustration clarifies the difference between two measures without pretending to establish an exchange-rate calculation, personal profit or guaranteed future result.
Which information would support a deeper currency comparison?
More detailed analysis requires official index rules, coordinated observation times and sufficiently precise underlying values. It is also useful to establish whether the compared indicators share constituents and how corporate-event adjustments are handled. Familiar index names appearing together in the news cannot substitute for this information. A fuller set of inputs can clarify the relationship between price and currency components. A short report primarily records the result and provides the context of a particular day.
The absence of that fuller set does not make the original report useless. It limits the conclusions available. Readers can accurately say that both reported indicators fell and that the RTS change was larger in magnitude. They can retain the different point levels with each index's own basis. However, an exact reconstructed exchange rate, the return of any portfolio and the next session's outcome go beyond those lines. Stating that boundary allows market news to remain useful without supplementing it with invented precision.
One session can have several accurate representations
The results for 2 October show why one market can have several useful measurements. Rouble and dollar bases need not produce identical daily percentages. Index levels retain their own histories, while a period's change answers a narrower question about movement. An official exchange rate with a later effective date remains a separate observation. Mixed performance among individual shares can coexist with a small aggregate fall. All these statements are compatible when one indicator is not substituted for another.
The reader's practical task is to preserve the unit, period and purpose of comparison. The levels of 2,277.21 and 859.29 points, alongside falls of 0.1% and 0.4%, then remain an accurate account of the reported session. They provide a starting point for understanding currency basis, rather than an answer to every investment question. This approach distinguishes measurement from commentary and subsequent calculations, keeping the useful information without promises or conclusions the source does not support.
A recorded result should allow the comparison to be understood again
A good market record provides enough information for another reader to understand which two observations were compared. Alongside the final value, useful details include the series name, the beginning and end of the period, and the source. Missing information should remain an identified limitation rather than being silently replaced with a convenient assumption. This discipline helps compare reports from different days: identical names do not guarantee identical intervals. It matters particularly in a table, where neighbouring columns can appear comparable even when they concern different dates.
Rounding should also be retained. A value with one decimal place represents less precision than a detailed underlying series. Extra digits produced by arithmetic on rounded numbers do not create new measurements. An editorial calculation should therefore use suitable inputs or retain moderate precision and a clear qualification. For this session, the published changes and levels are sufficient. Unsupported decimal places would not improve understanding, but could hide the limitations of the input data.
Finally, a repeatable comparison method is different from a repeatable market result. The same method can be applied to the next day without promising the same movement. The rule for reading the data remains stable, while prices change. Preserving that boundary helps explain financial statistics without turning an educational discussion into a prediction. An account of currency basis therefore ends with questions about measurement, rather than a recommendation to open a position on the evidence of one trading session.
Just Published

European housing prices and rents

Schneider–PTC: the industrial data integration test behind the deal

Avio USA starts work on its Virginia manufacturing site
One equity market, two currency measures

Russia’s draft budget raises spending and borrowing plans

Russia Sets the 2027 Minimum Wage at 28,935 Rubles, Up 6.8%, on the Way to 35,000 by 2030
Partner news digest
 Qatar LNG expansion: readiness, financing and the production test
 Pennon’s capital plan: turning finance into better water outcomes
 Italy’s diesel relief gap: taxes, price ceilings and implementation
 EU–China hybrid trade: from understanding to measurable implementation
 Schneider–PTC: the industrial data integration test behind the deal
 IKEA’s hybrid resale model: buyback, marketplace liquidity and furniture logistics
 Banking AI beyond the ranking: capability, execution and evidence of value
 Fishing labour beyond the product label: practical protection
 Rhenus and the Middle Corridor: terminals need coordinated connections
 Royal Mail restructuring: the test is reliable delivery
 Fuel Finder on Google Maps: when price transparency becomes useful competition
 Samsung’s memory profit surge: what the preliminary record explains
Leave a comment